
Math, data analysis, and computing
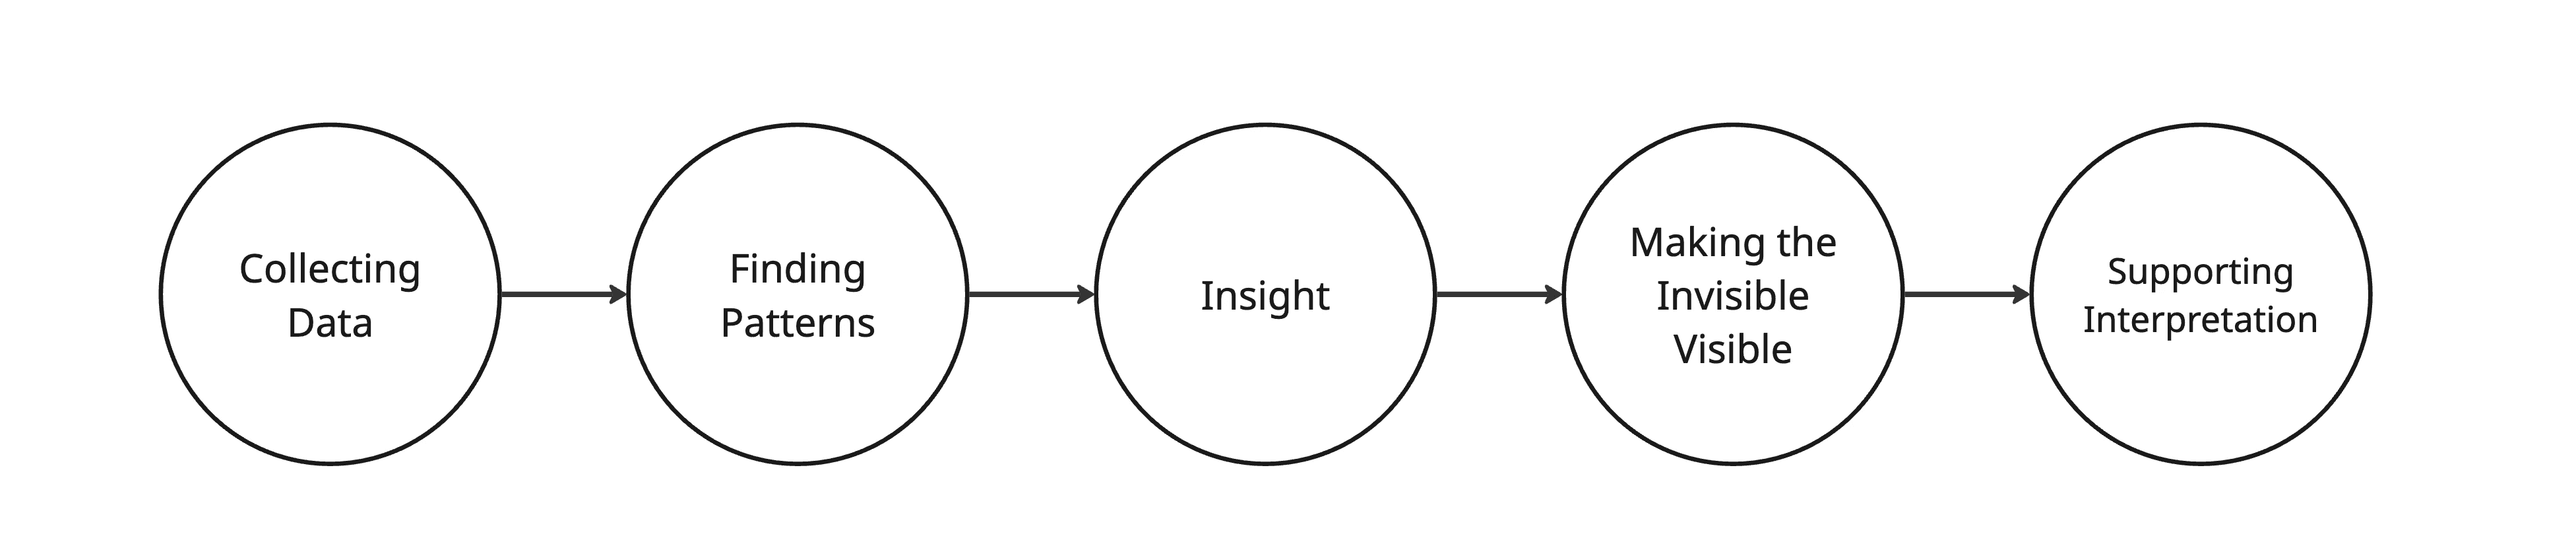
Figure 1. My approach to Math, Data Analysis & Computing, where data is transformed from observations into patterns, insights, and ultimately interpretable design outcomes.
Throughout my master’s journey, I came to see data not as objective facts, but as a medium for revealing patterns that would otherwise remain invisible. My work increasingly focused on translating abstract experiences, perceptions, and behaviors into forms that could support interpretation, reflection, and design decision-making (see figure 1).
Revealing Hidden Patterns
Data analysis allowed me to move beyond individual responses and identify recurring patterns in how people perceived and interacted with wildlife. In my M12 project on human–goose coexistence, I first explored mental model mapping as a way to analyze qualitative data. By clustering interview responses and workshop outcomes, I identified recurring patterns in how people perceived and interacted with geese. This process allowed me to move beyond individual opinions and understand broader behavioral tendencies. More importantly, it showed me that design opportunities often emerge from how people interpret situations rather than from the situations themselves.
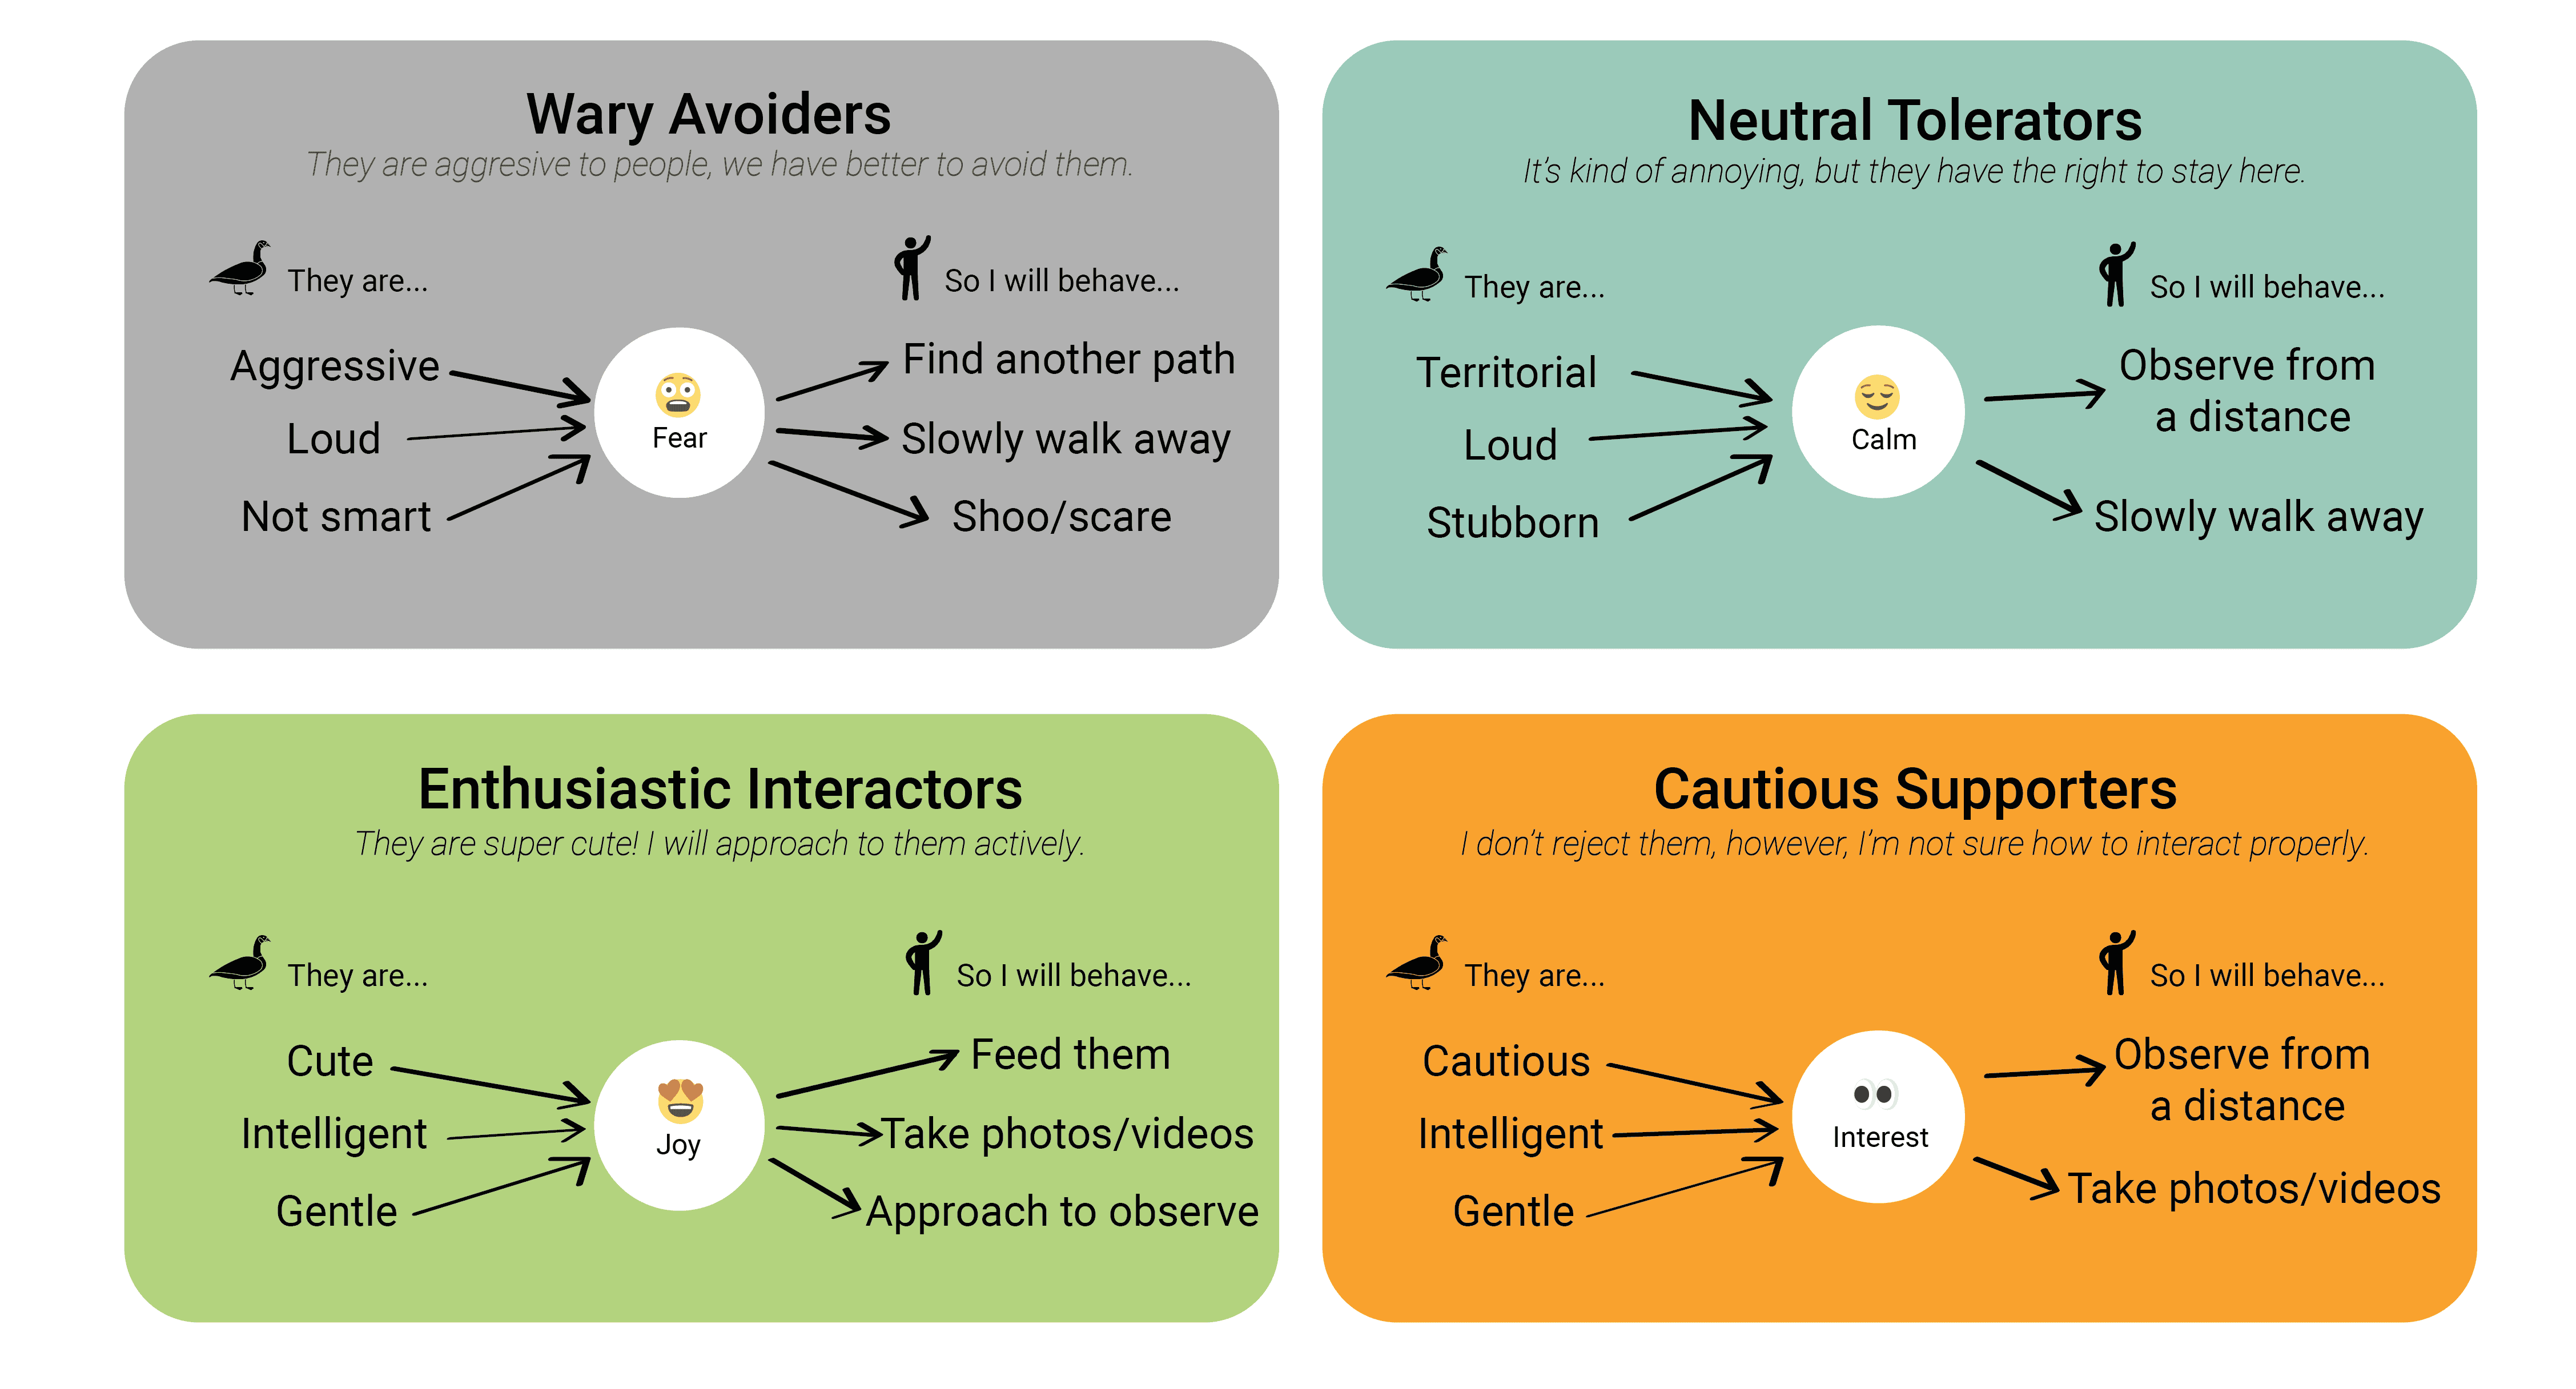
Figure 2. Mental model clustering revealed recurring patterns in how participants perceived and interacted with geese, enabling me to identify behavioral archetypes and uncover design opportunities beyond individual responses.
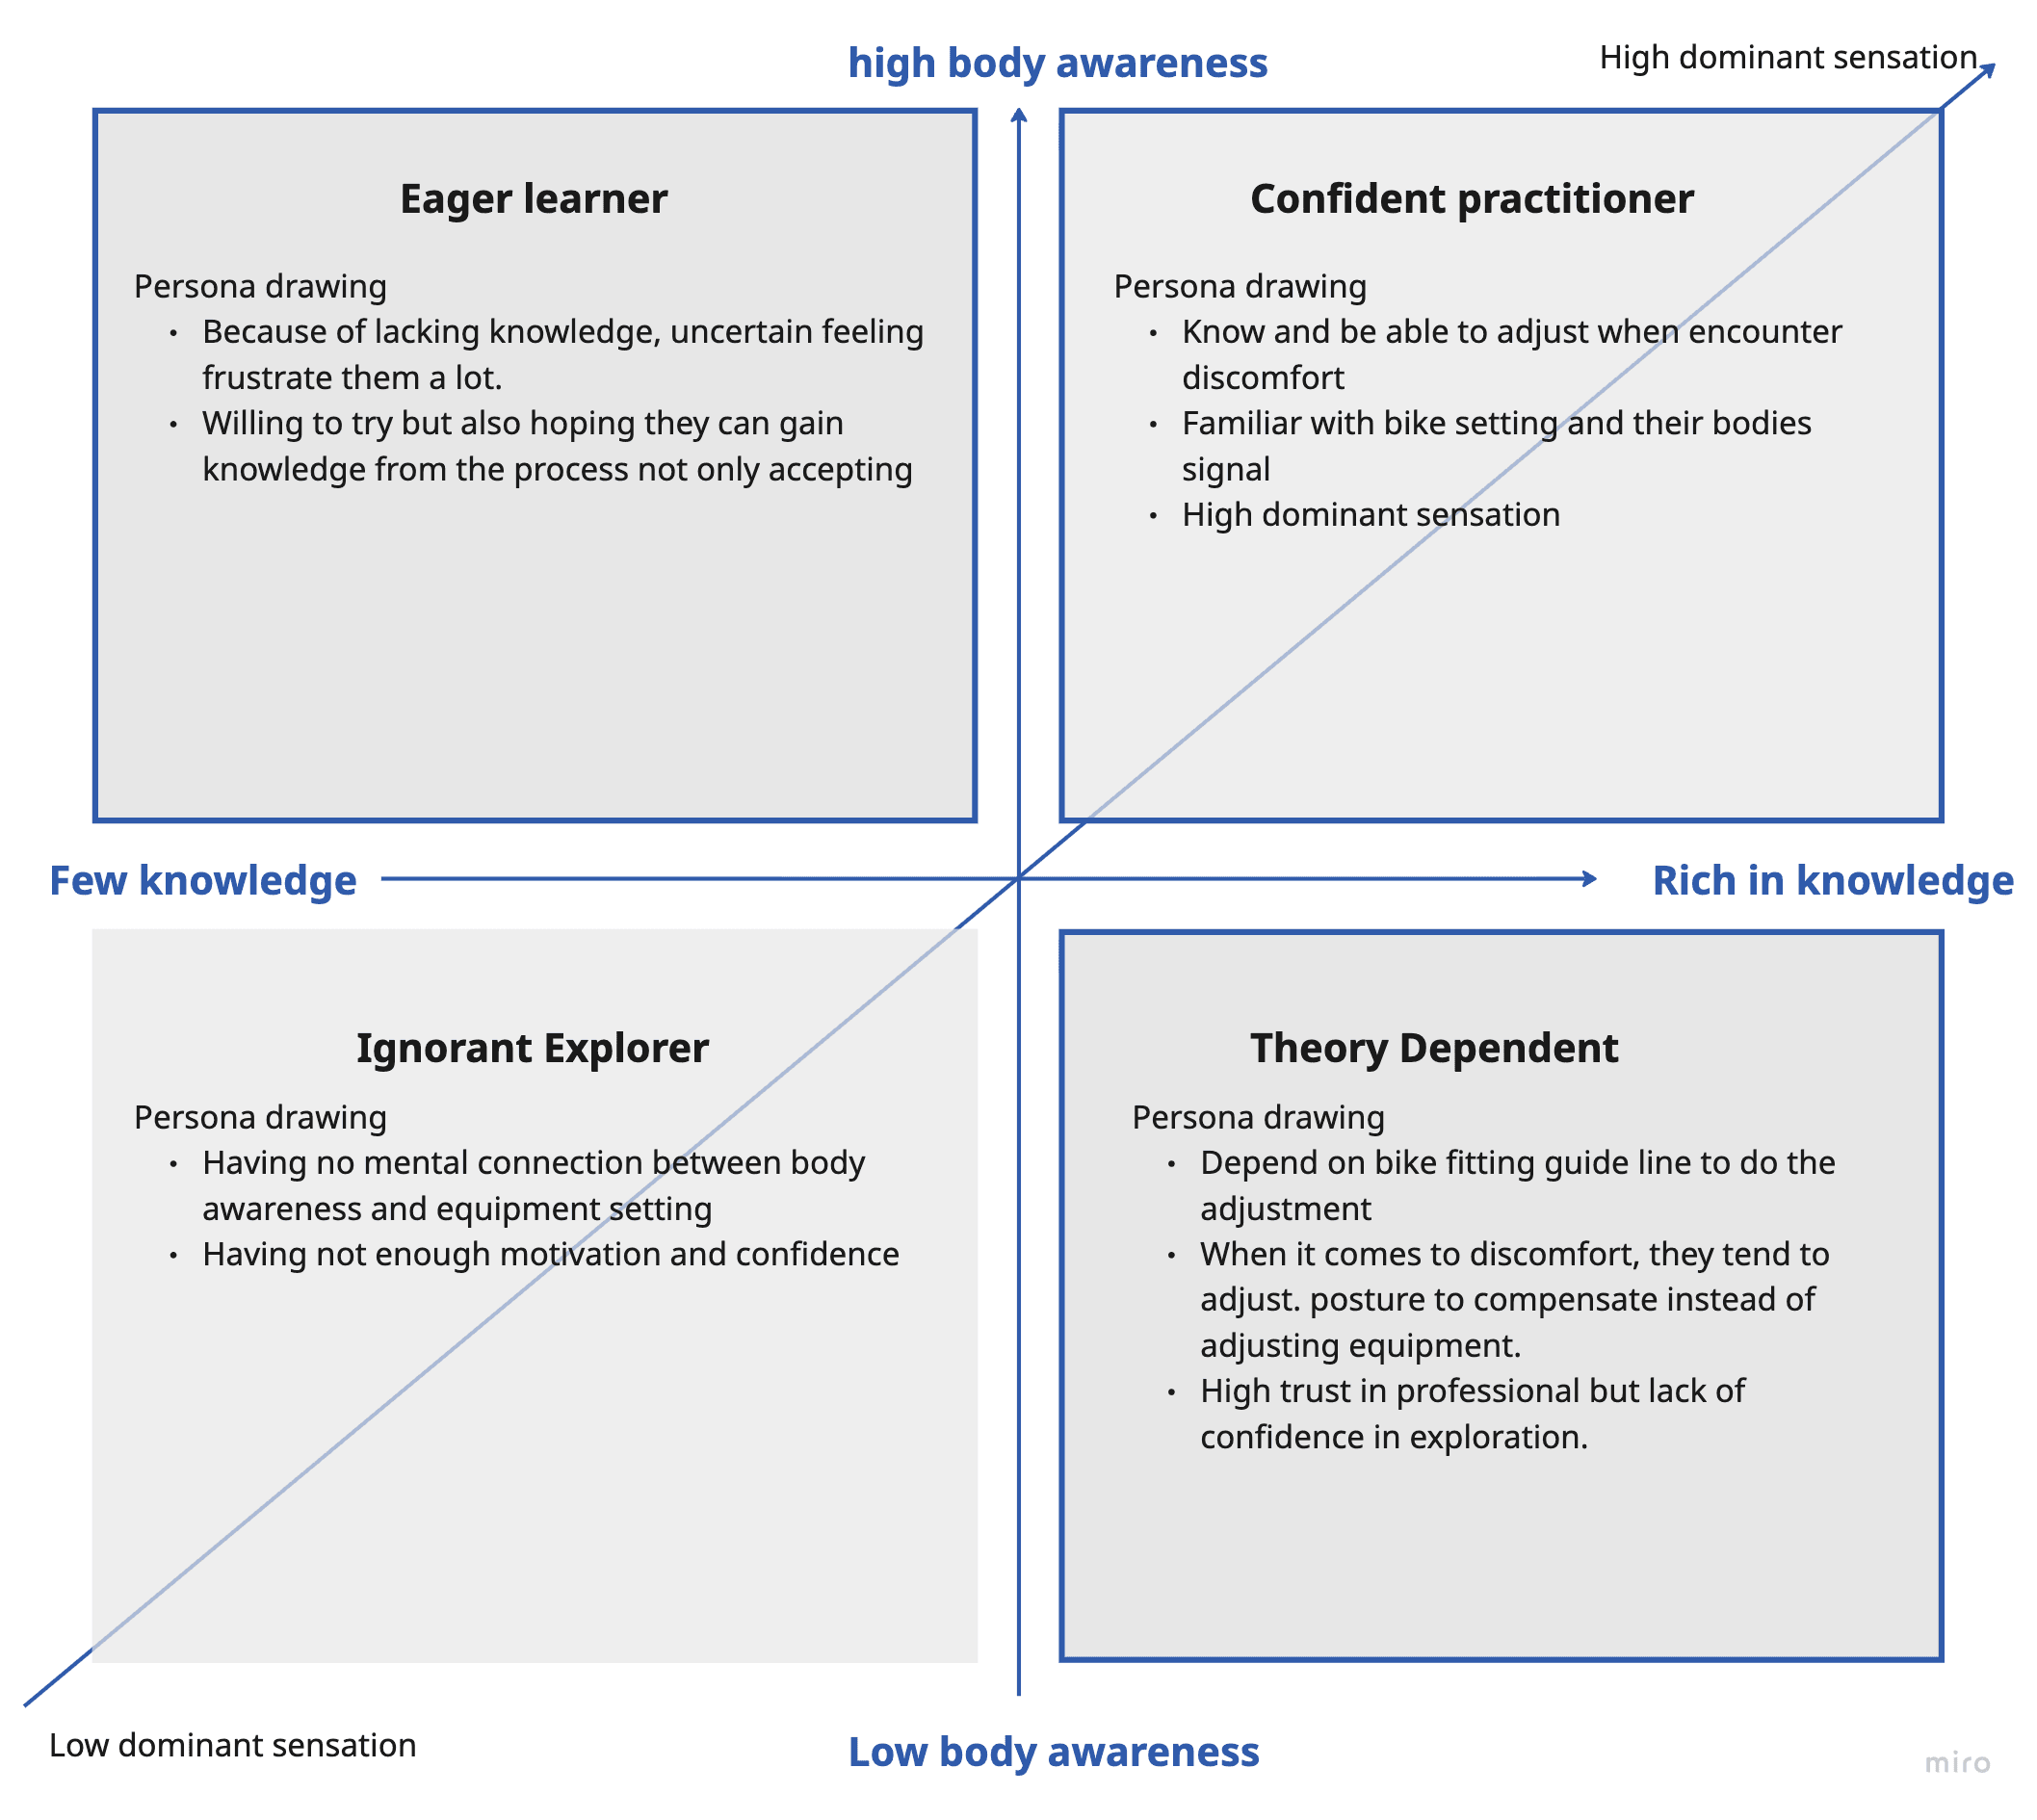
Figure 3. Participant mapping revealed differences in bodily awareness and interpretive ability, helping position the project and informing the conceptual direction of the FMP.
Data as Design Material
During my internship at Shimano, data became a tool for supporting design decisions. Through rider interviews, observational studies, body mapping, and pressure mapping data, I learned how quantitative and qualitative information could complement one another. Rather than treating data as evidence for a predetermined solution, I used it to frame questions, challenge assumptions, and better understand the relationship between physical performance and user experience.
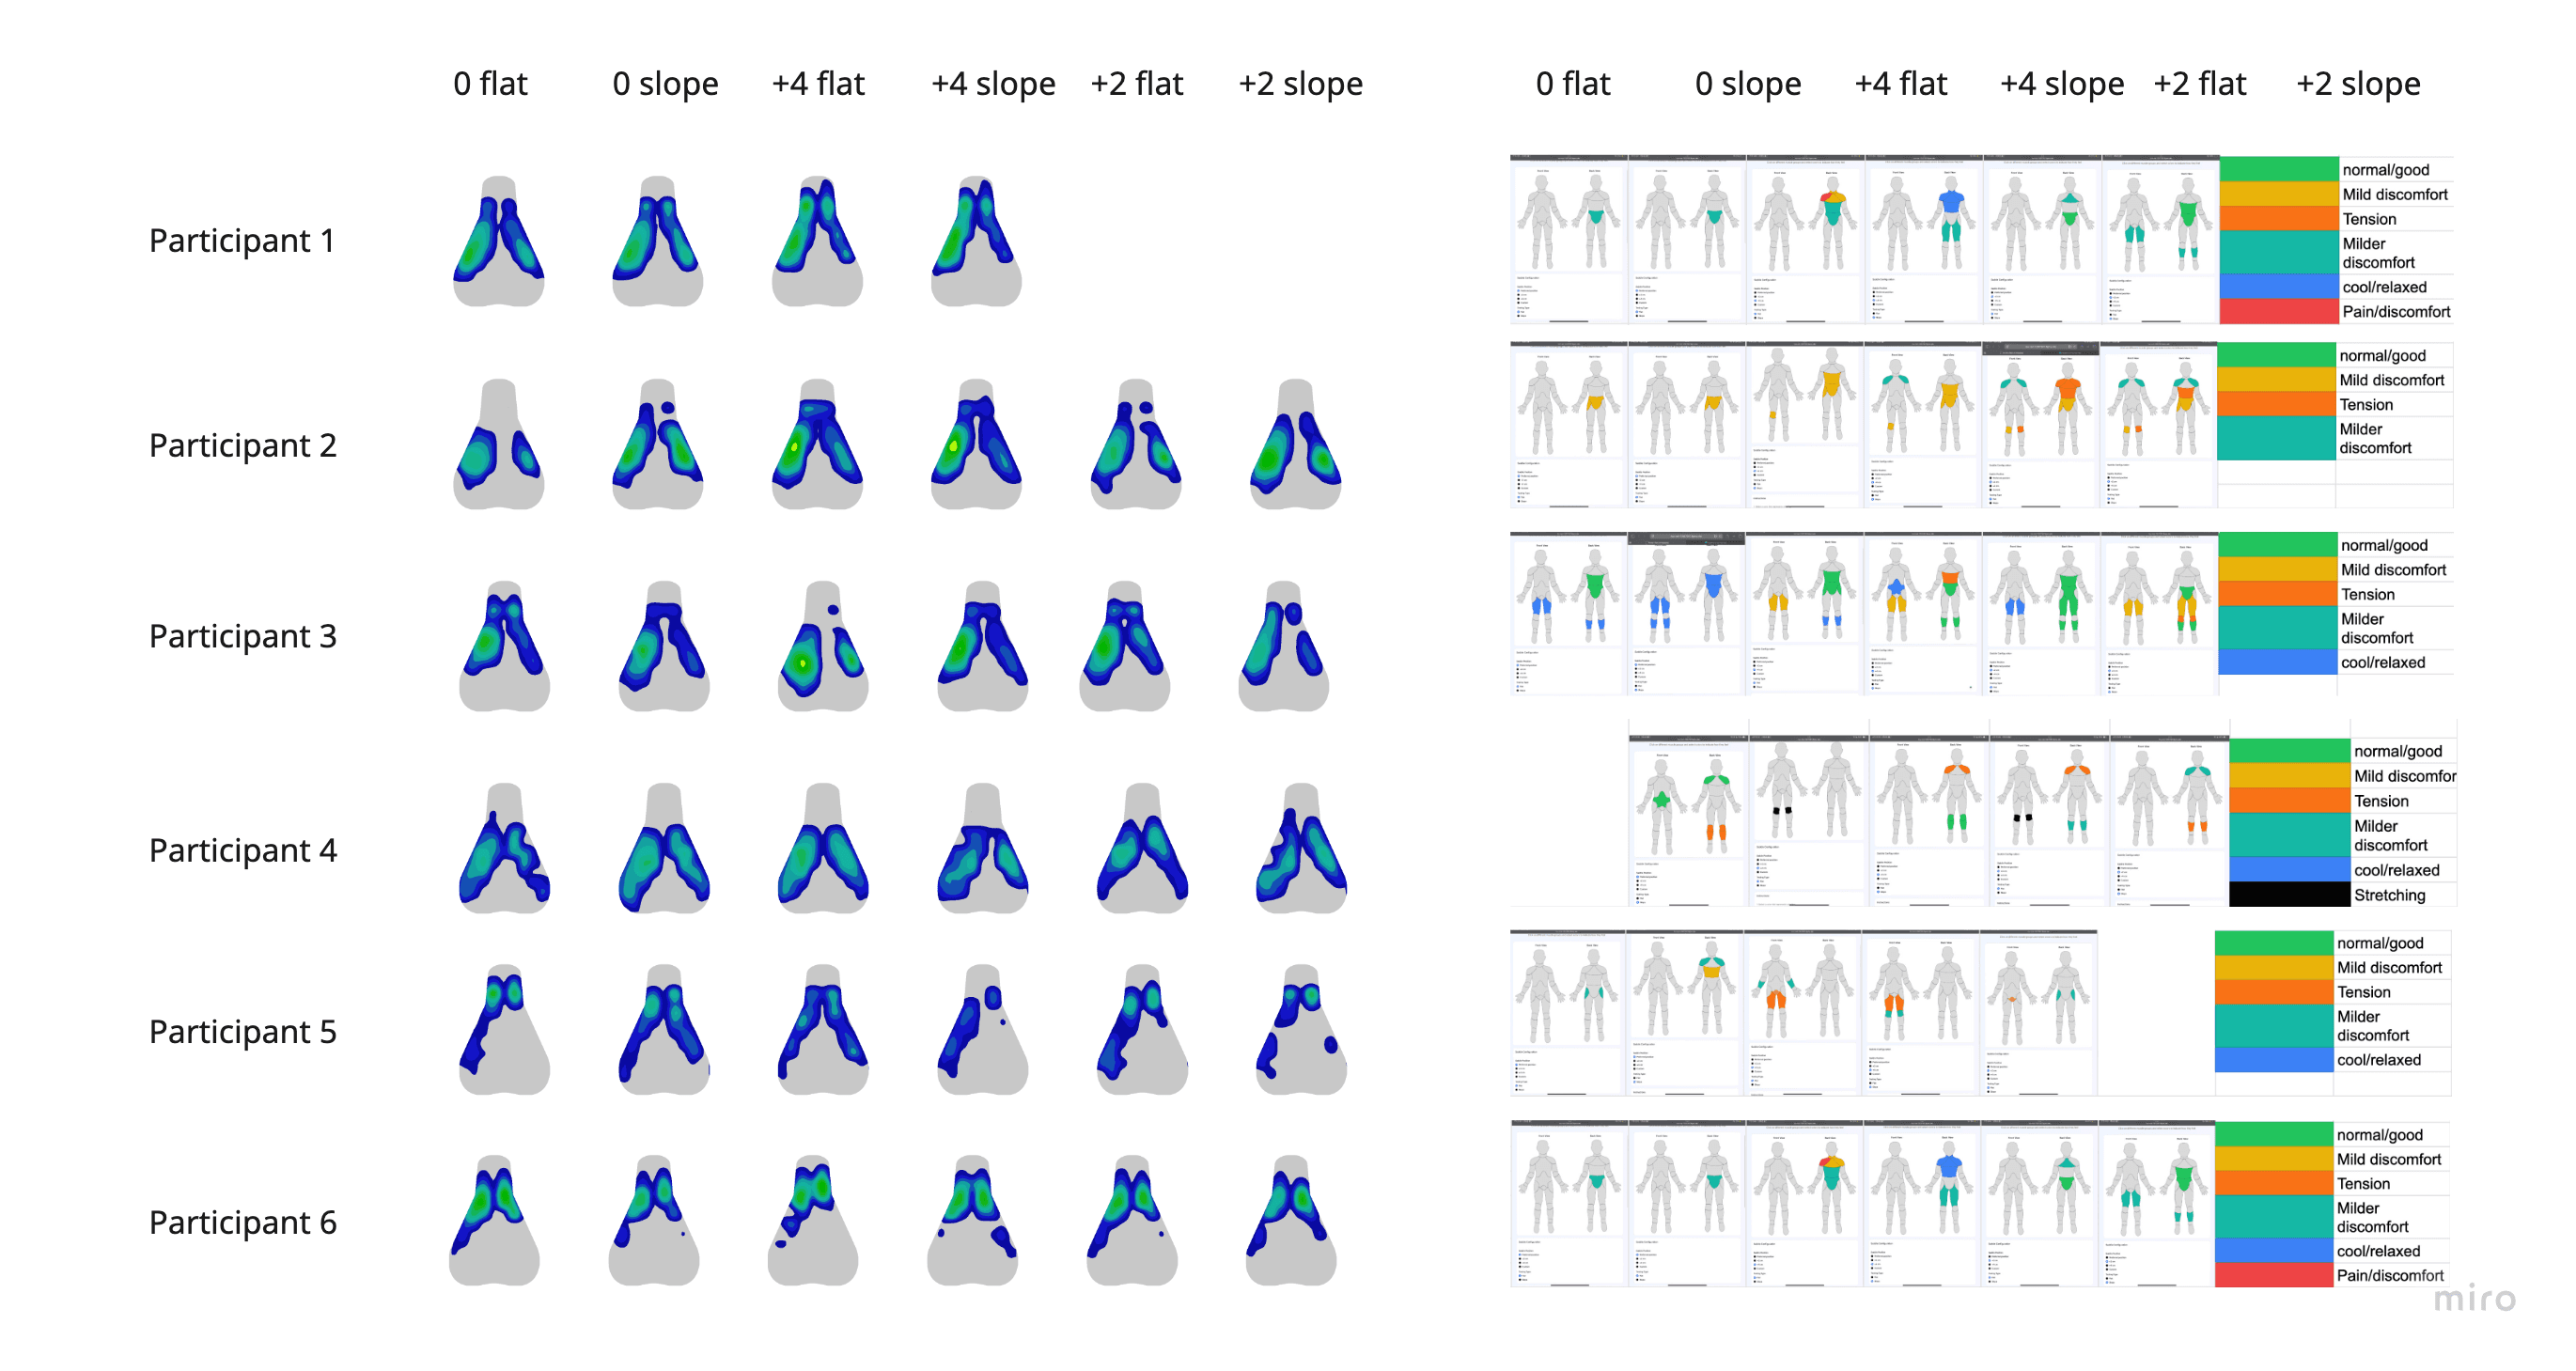
Figure 4. Combining pressure mapping data with qualitative reflections revealed gaps between riders’ physical behaviour and subjective experience, demonstrating how quantitative and qualitative data complement one another.
Computational Interpretation
My Final Master Project further expanded my understanding of computation. Using pressure sensors, Processing, and Python-based visualization systems, I transformed bodily movements into dynamic visual outputs and printable terrain artifacts. Computation was not used to optimize or evaluate participants, but to translate invisible bodily experiences into forms that could be perceived, interpreted, and reflected upon. This project demonstrated how data can function as a design material rather than merely a measurement tool.

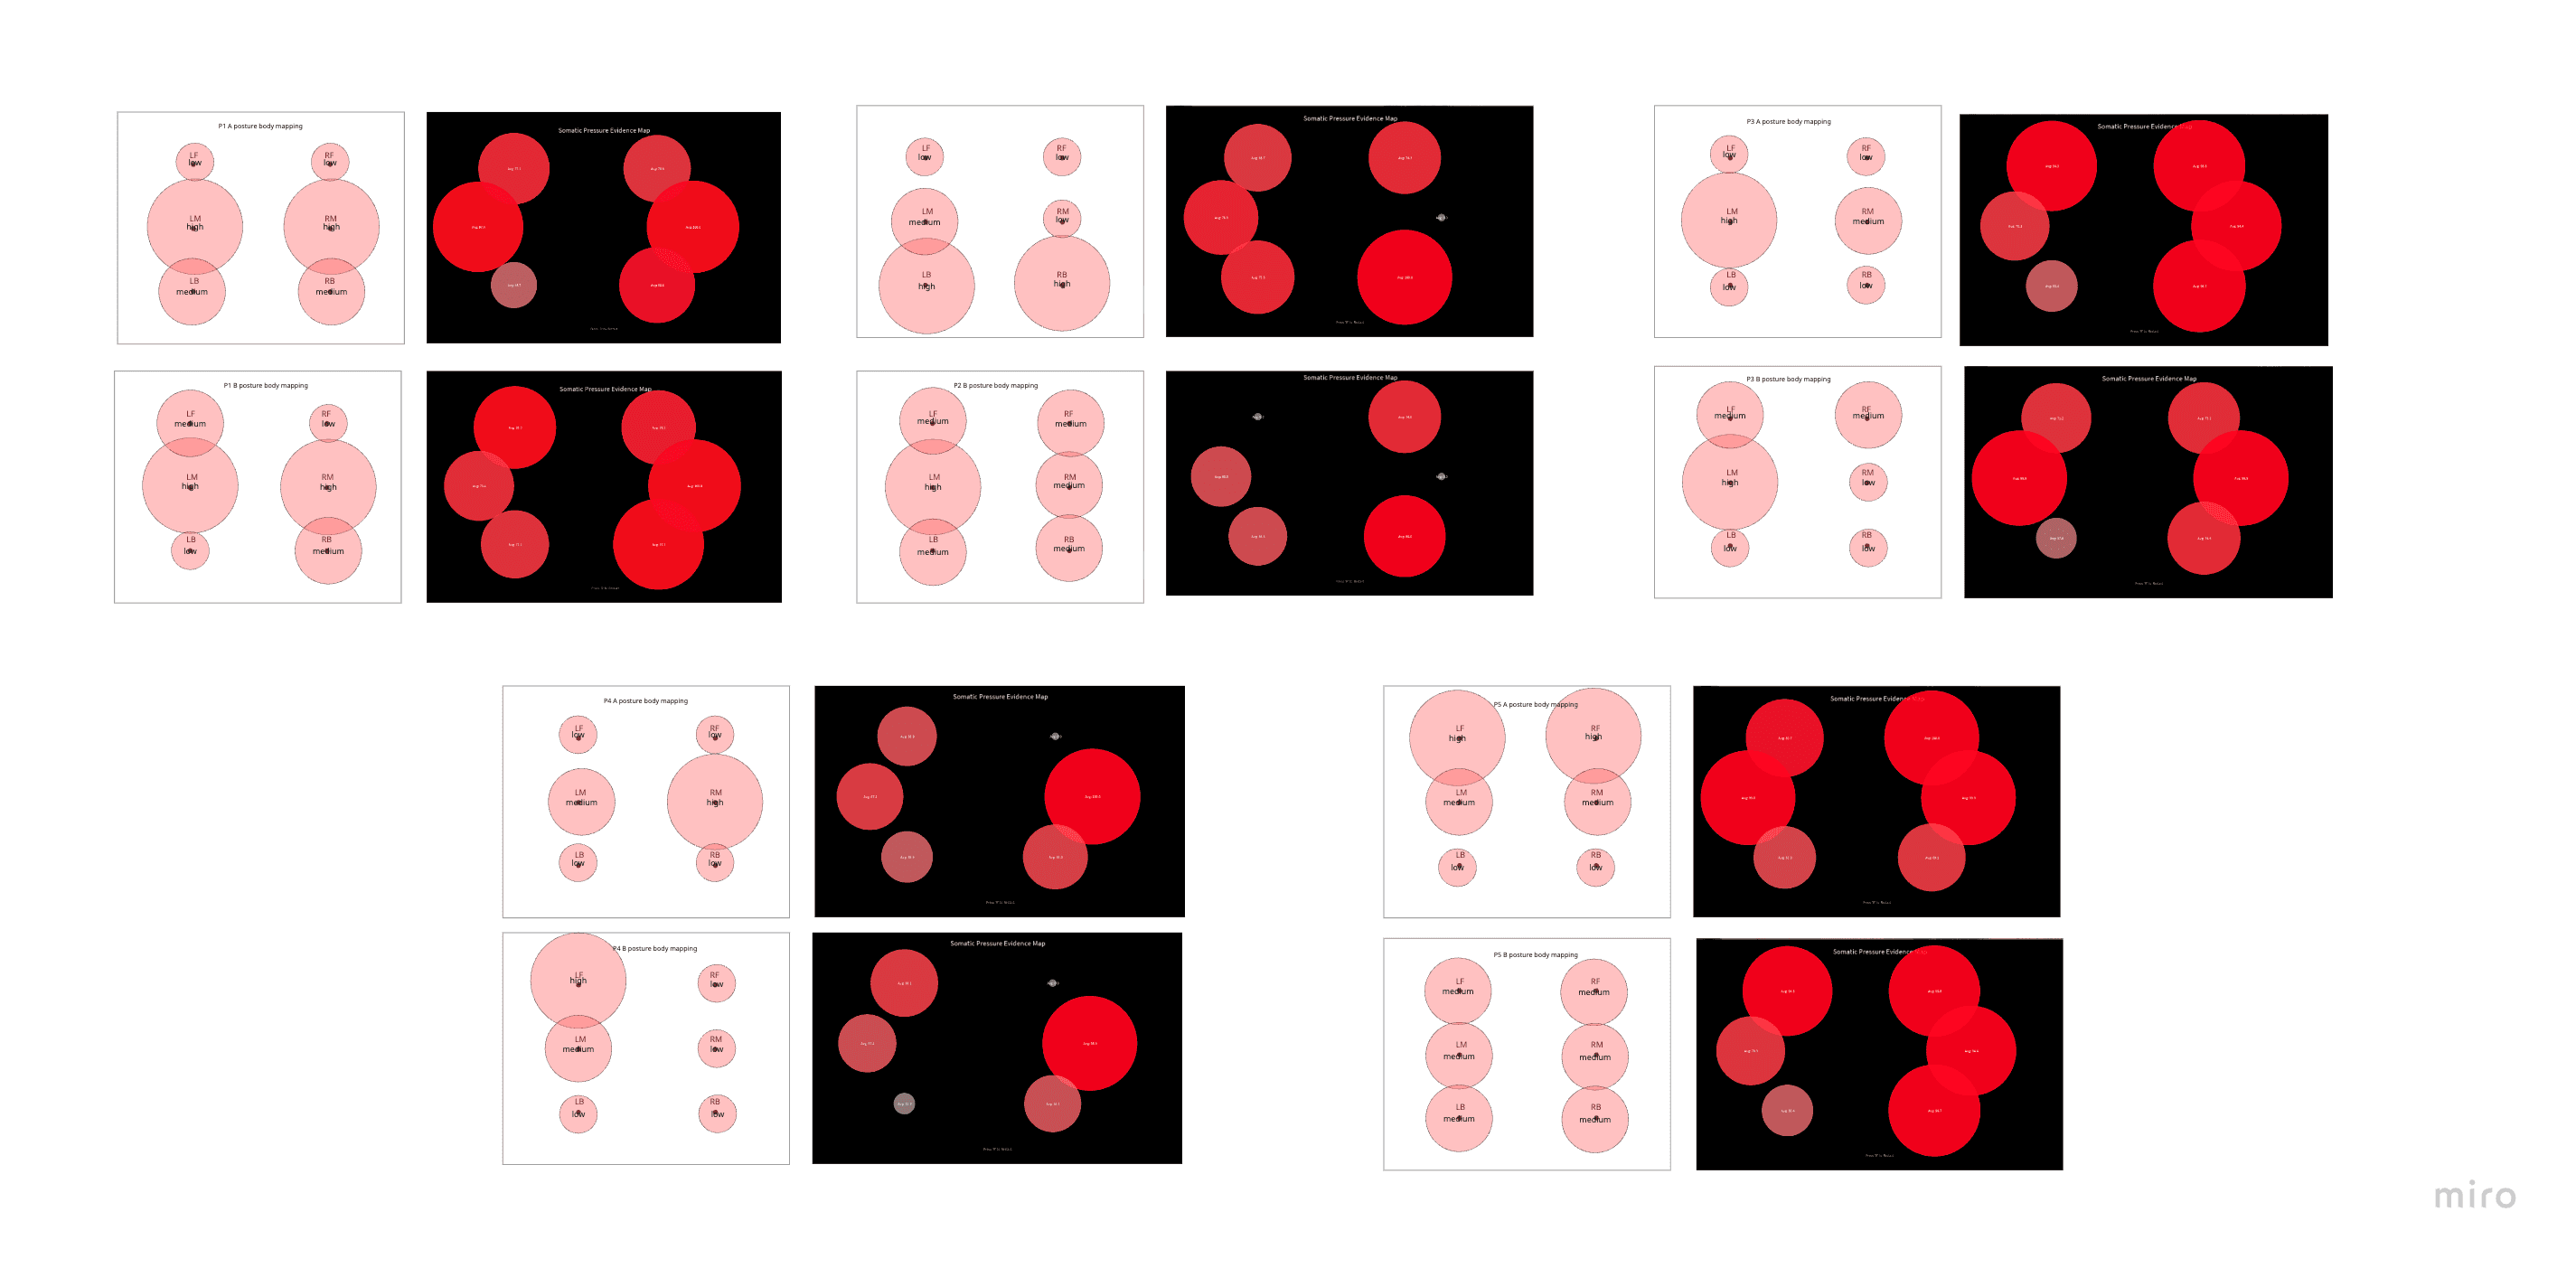
Figure 5. Early visualization methods highlighted differences between measured pressure distributions and participants’ own interpretations of bodily sensations, revealing limitations of data-driven representations.
In my FMP, algorithms were not used to classify, evaluate, or optimize participants. Instead, they were used to translate sensor data into visual artifacts that supported personal interpretation and reflection. Therefore, I transformed the previous data into a neutral body terrain image (see figure 6).
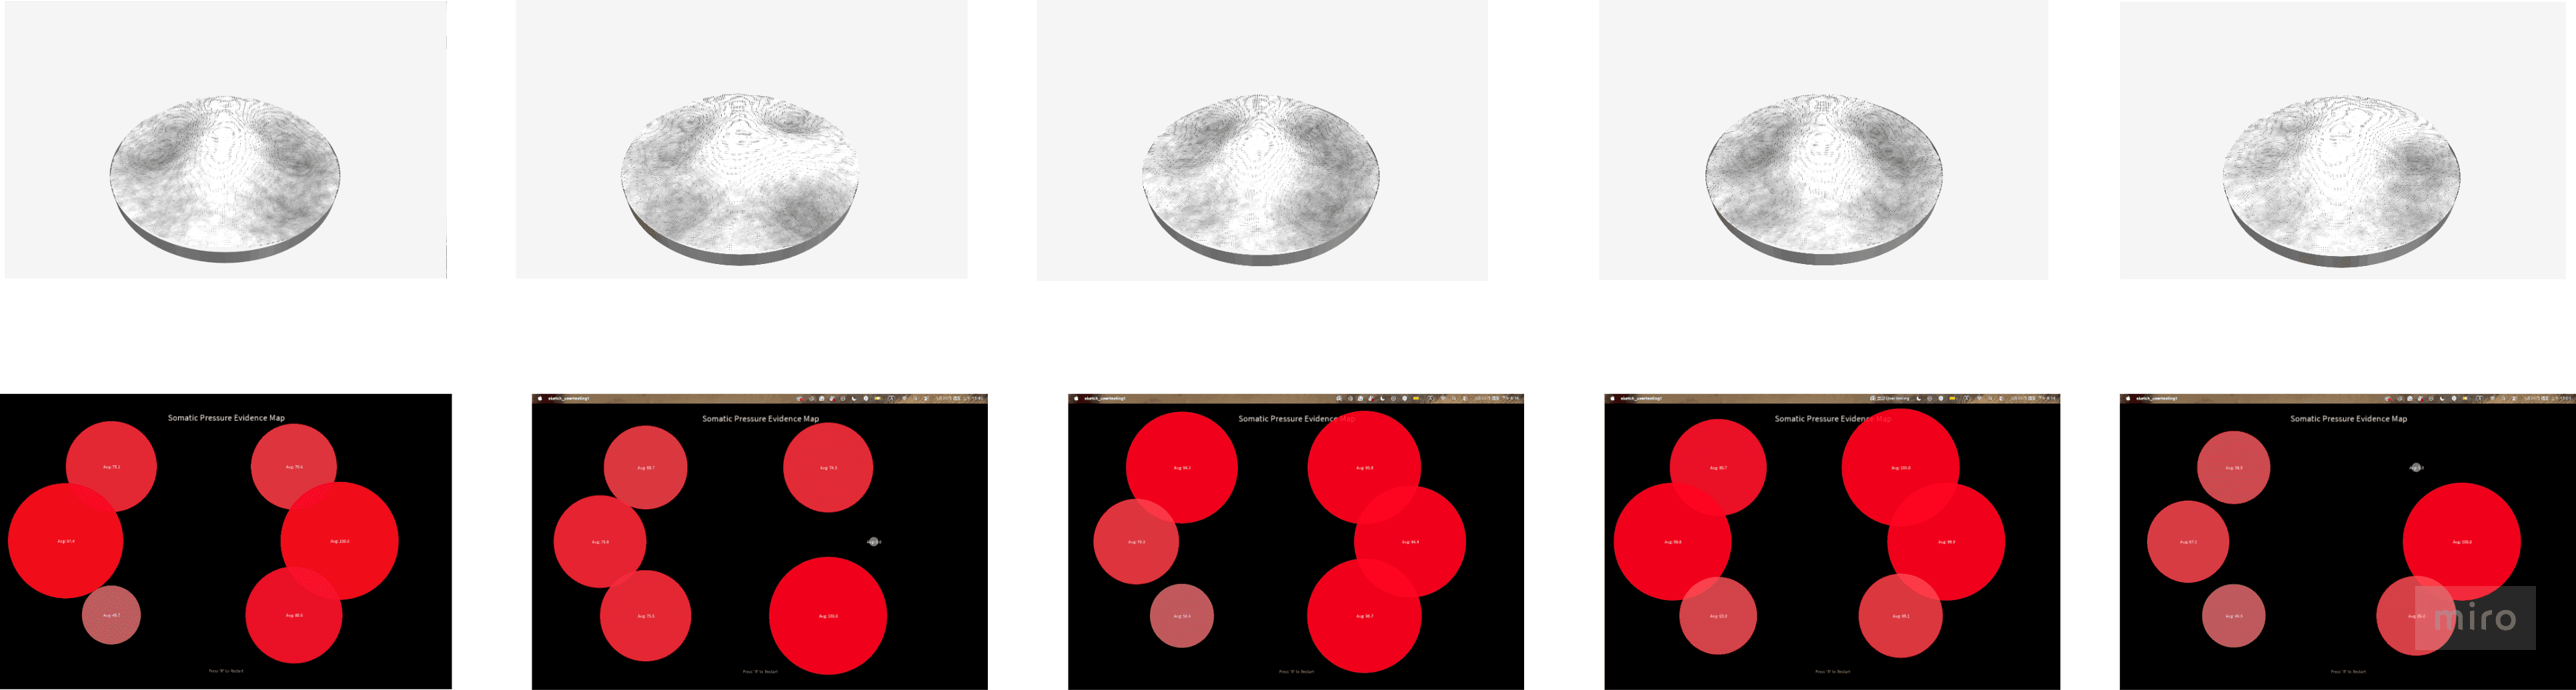
Figure 6. Since the first method to interpret body awareness turned into a correctness issue told by the users, I turned the statistical data into a neutral data presentation visual. I learned that the most important thing for the users is not the raw data, but how to transform that information into a way that they can interpret or reflect on matters more.
DPM120 Project 2 design research
DDPM210 Preparation Final Master Project
DBM190 Designing with and for digital twins: A data-driven design perspective
DDPM220 Final Master project


AI statement
Several computational systems presented in this portfolio were developed with the support of AI-assisted programming tools (e.g., ChatGPT and Gemini). AI was primarily used for code generation, debugging, and exploring alternative implementation approaches. The underlying research questions, data structures, analytical frameworks, interaction logic, and design decisions were defined, evaluated, and refined by the designer throughout the process.